Multi-instance LLM serving: why 3× the memory bought only 9% more throughput.
I built the fix everyone suggests for the flat line in Part 1 — K process-isolated LLM instances behind 1 queue — and measured it at K = 1, 2, 3. The real ceiling on Apple Silicon isn’t the lock. It’s the memory bus, and the arithmetic proves it.
K process-isolated instances of a 4-bit 7B model, K = 1 → 3 on 24 GB of unified memory: aggregate throughput gains cap at +9% for 3× the RAM, while every stream’s decode rate degrades almost linearly. The arithmetic says why — 1 instance already streams ~250 GB/s of the M4 Pro’s ~273 GB/s unified-memory bandwidth. The bus was the ceiling all along, only continuous batching gets past it, and nothing ships continuous batching for Metal.
The number I didn’t believe
When the K=3 run finished, I did what you do with a result you don’t believe: I ran it again. And again. Same number. 3 process-isolated instances of the model — 3× the memory, 3× what everyone calls “capacity” — delivered 9% more tokens per second than 1 instance.
This post is the follow-up to Part 1, where a single model instance serialized every request through a lock and throughput stayed flat from 1 user to 32. The fix every discussion thread suggests is to stop serving from 1 instance: just run K of them. So I built exactly that — a dispatcher running K engine instances in K isolated processes, draining 1 shared request queue — and measured it properly.
I’ll be honest about my prior going in. I’d done the back-of-envelope math and suspected the win would be modest. But an estimate is not a measurement, and this particular number decides something real: whether “buy more Macs” is a scaling strategy or a waste of money. The measurement says waste. Here’s the arithmetic behind it, step by step.
Building the honest version
The lazy implementation of “run K instances” is threads. It’s also wrong, twice over: the per-instance lock from Part 1 still serializes everything, and Python’s GIL throttles decode on top of it. Threads would understate the machine — you’d be measuring Python, not the hardware.
So bench.py dispatch runs each instance as its own process
(spawn context — fork and Metal do not get along), each with
its own warmup, because Metal kernel compilation is lazy and per-process: skip the
warmup and you’re benchmarking the compiler. All K processes drain 1 shared request
queue under the same workload contract as Part 1 — same 12 prompts, greedy decode,
max_tokens=256. Two details worth calling out:
- Queue-inclusive TTFT. Measured from submit to first token, across process boundaries — the latency a client actually feels, not the engine’s private view.
- Worker RSS sum. The true RAM cost of K instances, summed per worker — the number a capacity plan needs.
Full additions to the fairness contract are in
docs/methodology.md.
K is capped at 3 by the 24 GB of unified memory — a fourth ~4.5 GB instance risks swap,
and swap makes every number in this post garbage.
The result
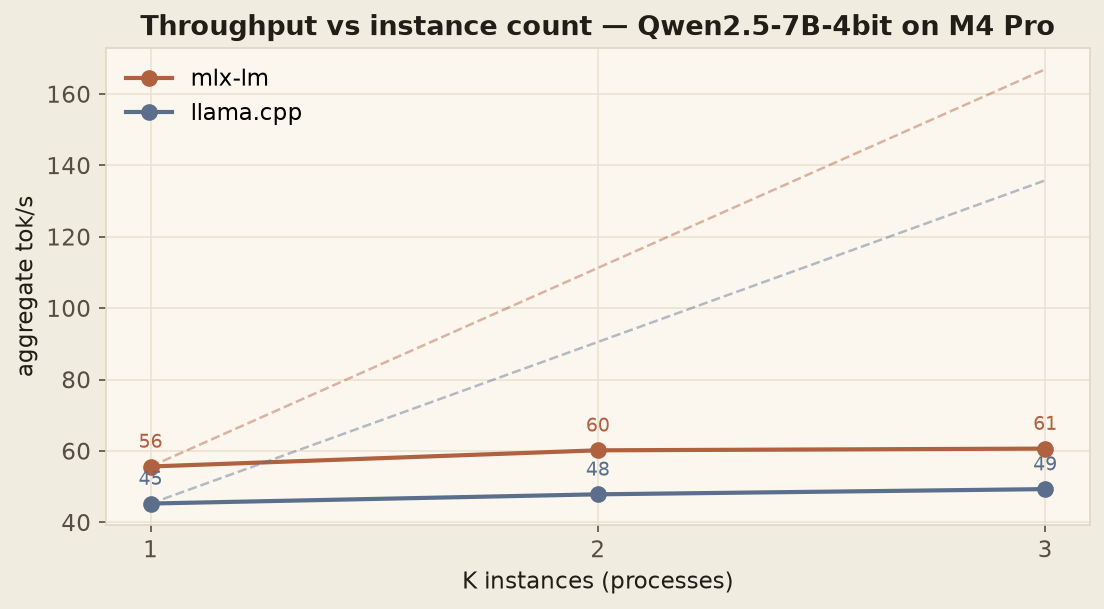
| Engine | agg tok/s @ K=1 | @ K=2 | @ K=3 | TPOT per stream |
|---|---|---|---|---|
| mlx-lm | 55.6 | 60.2 (+8%) | 60.7 (+9%) | 17 → 32 → 48 ms |
| llama.cpp | 45.3 | 47.8 (+6%) | 49.3 (+9%) | 22 → 41 → 60 ms |
3× the memory buys single-digit throughput. And the TPOT column is the tell: each individual stream’s decode rate degrades almost perfectly linearly with K. The instances aren’t adding capacity — they’re dividing the same saturated resource among more users.
Dividing what resource? That’s the question the rest of this post answers.
The arithmetic
Step 1 — how many bytes does 1 token cost?
Qwen2.5-7B has ~7.07 billion parameters. At 4-bit quantization that’s 0.5 bytes each for the bulk of them:
7.07 × 10⁹ params × 0.5 B/param ≈ 3.5 GB
Embeddings, norms, and the Q4_K_M mixed-precision blocks add weight kept at higher precision, plus KV cache and runtime state. Measured peak RSS: 4.3 GB (mlx), 4.7 GB (llama.cpp). Call the working set ~4.4 GB per instance.
Autoregressive decode is the worst case for memory: to emit token t, the model performs 1 forward pass that touches every weight exactly once. There is no reuse, no cache-friendly locality to exploit — the weights are the per-token working set. So:
bytes moved per output token ≈ 4.4 GB
Step 2 — is decode compute-bound or memory-bound?
A quick roofline check settles it. Each weight participates in 1 multiply-accumulate per token — 2 FLOPs per parameter, so 1 token of decode costs:
2 × 7.07 × 10⁹ ≈ 14 GFLOP per 4.4 GB ⇒ ~3.2 FLOP per byte
The M4 Pro’s GPU offers roughly 17 TFLOPS against 273 GB/s of bandwidth — a machine balance of ~62 FLOP per byte. Decode needs 3.2. The workload wants 19× less compute per byte than the chip can balance: decode is memory-bound by an order of magnitude, on any hardware, not just this one. Faster kernels can’t fix a bound like this; only moving fewer bytes per token can.
Step 3 — so how saturated is 1 instance?
mlx-lm’s warm single-stream rate is 56 tok/s. Multiply:
The first instance — the single-user case, Part 1’s flat line — already runs the bus at ~90% of spec. And this is a lower bound: KV-cache reads grow with context length and ride the same bus, so true pressure is higher. The headroom left for any additional instance is:
(273 − 246) / 246 ≈ 11% max additional throughput
Measured at K=3: +9%. The prediction and the measurement close almost completely — the missing couple of points are scheduler overhead and KV traffic. The +9% isn’t weak scaling; it’s the entire remaining bus, recovered.
Step 4 — the invariant that pins the wall
If K instances were genuinely independent capacities, total memory traffic would scale with K and the product below would grow. If instead they share 1 fixed bus, the product must stay pinned at the bus rate. Multiply each stream’s measured decode rate by its per-token bytes, then by K:
| K | per-stream tok/s (mlx) | × 4.4 GB | × K = total GB/s |
|---|---|---|---|
| 1 | 55.8 | 246 GB/s | 246 |
| 2 | 30.1 | 132 GB/s | 265 |
| 3 | 20.4 | 90 GB/s | 269 |
The product doesn’t grow with K — it converges upward toward a hard limit and stops: 246 → 265 → 269, ceilinging at the M4 Pro’s 273 GB/s spec. That is the signature of a shared fixed resource. llama.cpp shows the same shape at lower effective bandwidth (213 → 225 → 233 GB/s at 4.7 GB/instance) — its kernels extract less of the bus per pass, which is exactly the Part 1 finding that mlx decodes faster, but the wall it hits is identical.
And the per-stream cost falls out of the same equation: total bandwidth is fixed, so each stream gets roughly β/K, meaning TPOT scales with K:
TPOT(K) ≈ K × 4.4 GB / β
Measured: 17 → 32 → 48 ms (mlx) and 22 → 41 → 60 ms (llama.cpp). Near-perfect proportionality to K, exactly as the shared-bus model predicts.
Once you see the arithmetic, the chart stops looking like a bug and starts looking like physics.
Two ceilings
The ceiling diagram on Apple Silicon has 2 layers, and this benchmark separates them:
- The lock ceiling — 1 instance serializes every request (Part 1’s flat line). Removed by running K instances.
- The bandwidth ceiling — remove the lock, and the memory bus becomes the limit (this benchmark). Each instance draws ~4.4 GB per token from the same ~273 GB/s; the first one already takes 90% of it.
Part 1 measured layer 1 and thought it was the floor. It wasn’t — it was sitting on layer 2.
Why continuous batching is the only real fix
Everything above reduces to 1 ratio: bytes of weights moved per token served. A lone stream pays the full 4.4 GB. But a batched forward pass over B concurrent requests reads the weights once for the whole batch — the same bytes amortize over B tokens:
bytes per token = 4.4 GB / B ⇒ same bus, B× the streams
That division — not instance count, not kernel tuning — is the entire reason
vLLM, SGLang, TensorRT-LLM, and TGI
exist, and why “just run K instances” is not a substitute for any of them. None of the
continuous-batching engines run on Apple Silicon today. So on a MacBook Pro your real
options are exactly 3:
- 1 instance, serialized — measured here, at its ceiling.
- K instances — measured here, recovering the last ~10% of the bus for 3× the RAM.
- Wait for someone to ship continuous batching for Metal.
1 methodology footnote: under memory pressure, macOS/Metal page accounting makes mlx
workers’ reported RSS wander between runs, while llama.cpp’s reports scale linearly —
the RSS figures above use llama.cpp’s accounting where they must agree. All caveats in
docs/methodology.md.
What I’d actually do with this
- Single user or async batch jobs: the laptop is enough. 45–56 tok/s on a 7B model with zero per-token cost, zero network latency, and full data privacy. Genuinely competitive with GPT-3.5-class APIs for 1 consumer.
- A team: this data retires the “fleet of cheap Macs” plan. Mac farms multiply RAM, power, and dollars for single-digit throughput — the bus doesn’t replicate across instances on 1 SoC, and a fleet of separate Macs just parallelizes the queue, it doesn’t raise per-instance rates. The honest multi-user answer is a cloud GPU behind a continuous-batching engine.
- Engine choice still follows workload shape — TTFT-sensitive chat to llama.cpp, decode-heavy generation to mlx-lm (Part 1’s decision table).
What’s next
The bandwidth model above makes a testable prediction. An H100 offers ~3.35 TB/s of HBM against the M4 Pro’s 273 GB/s:
3,350 / 273 ≈ 12× the memory bus ⇒ ~12× the decode ceiling
Phase 2 rents an H100 for a day and runs this exact workload against vLLM and TensorRT-LLM with continuous batching. If the same arithmetic holds, the interesting number that falls out is the cost-per-token crossover — the exact concurrency at which cloud GPU becomes cheaper than buying another MacBook. Same fairness contract, same 12 prompts, 1 chart that answers “local or cloud?” for good.
Reproduce
git clone https://github.com/anubhavagr/inference-lab
cd inference-lab
uv venv && source .venv/bin/activate
uv pip install mlx-lm llama-cpp-python matplotlib rich

hf download mlx-community/Qwen2.5-7B-Instruct-4bit --local-dir models/qwen25-7b-mlx-4bit
hf download bartowski/Qwen2.5-7B-Instruct-GGUF --include "*Q4_K_M*" --local-dir models/qwen25-7b-gguf-q4k

# K-instance dispatcher, K = 1, 2, 3 (1 process per instance)
python bench.py dispatch mlx   models/qwen25-7b-mlx-4bit
python bench.py dispatch llama models/qwen25-7b-gguf-q4k/Qwen2.5-7B-Instruct-Q4_K_M.gguf

python -m bench.plots
Run it on your own machine and check Step 4 yourself: multiply your per-stream tok/s by your model’s GB and by K. If it pins near your chip’s memory bandwidth — and it will — you’ve found your ceiling too.